
Geotechnical instrumentation data, from the sensors on site to the people who act on it
PICO Monitoring charts the data from piezometers, inclinometers, settlement points, and other instruments at their reporting interval, checks each reading against its instrument’s thresholds, and maintains a secure record of what was reported and when.
What happens to a reading
- 01
Readings arrive
The sensors and hardware on the project report on a set interval, every hour for example, and each batch of readings lands in PICO Monitoring. Readings are compiled into one record, so the project works from one dataset.
- 02
Charted and mapped
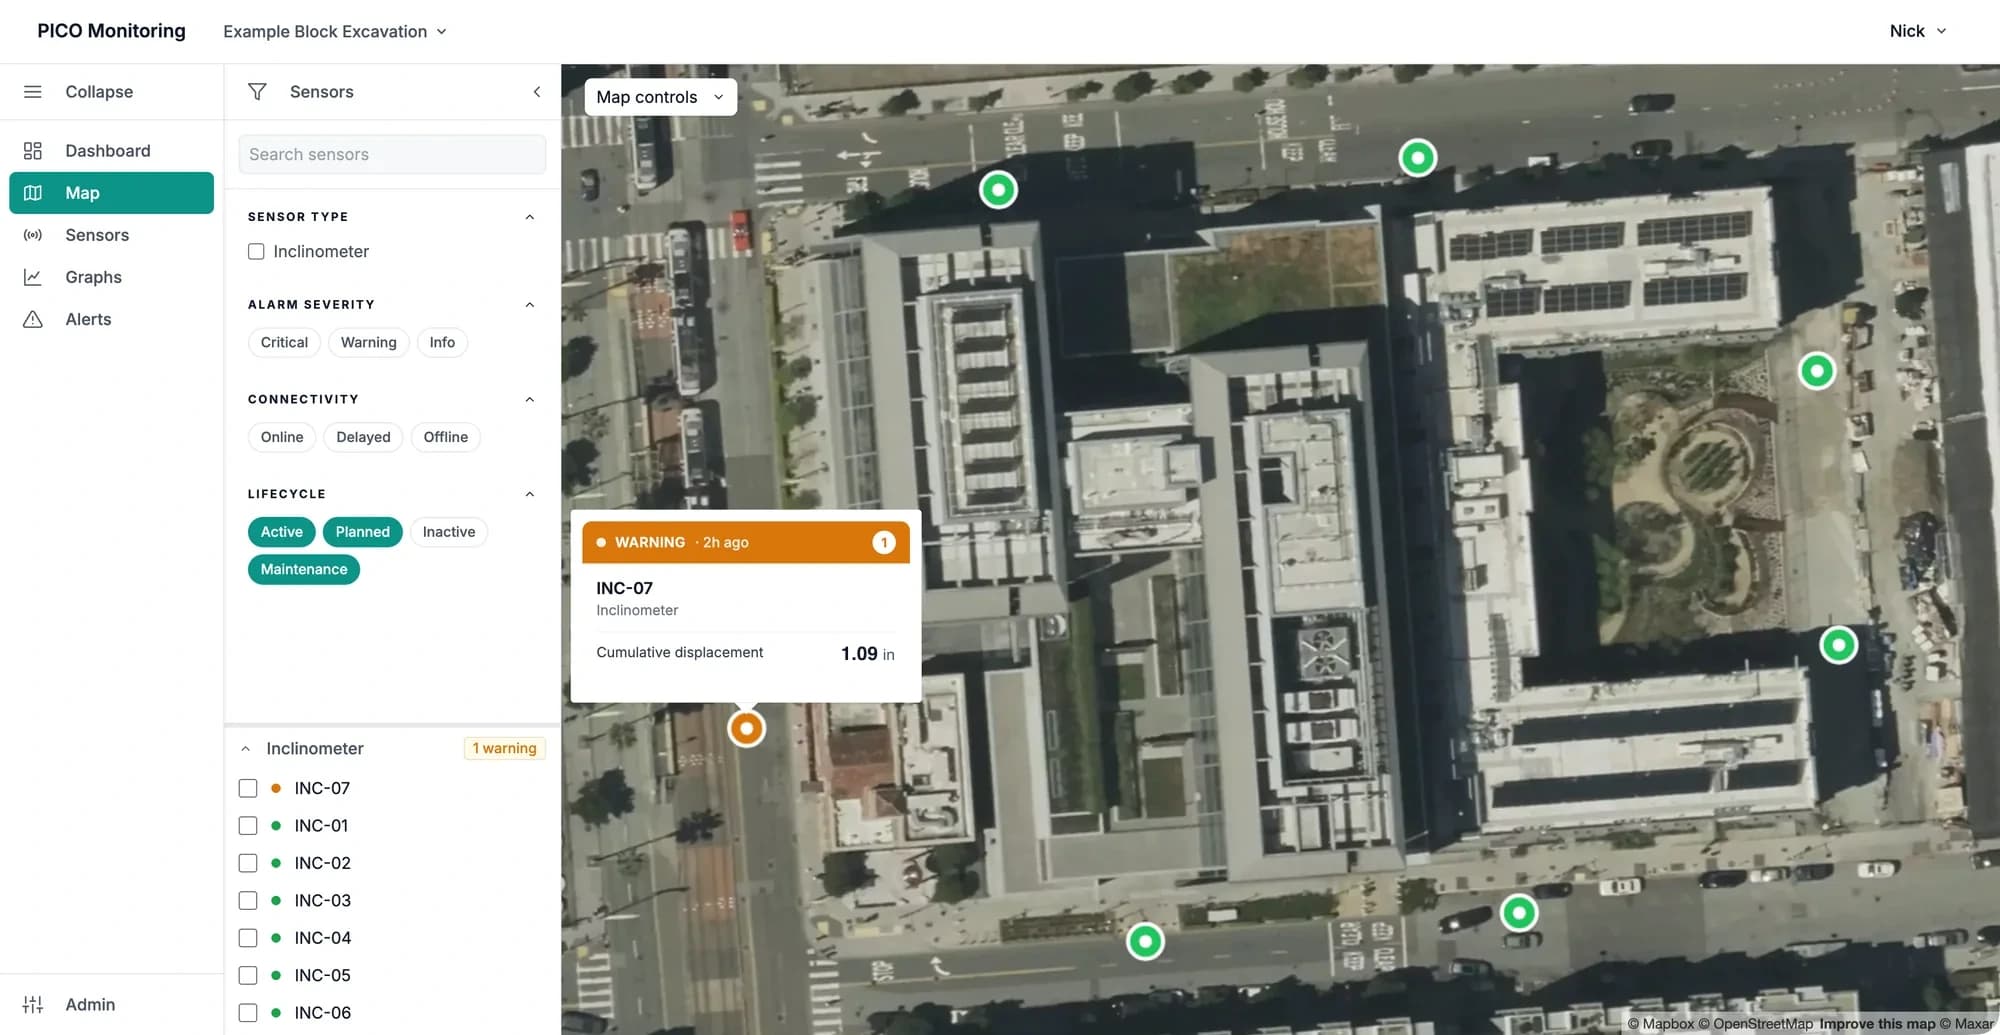
Each instrument is plotted on a time-series chart, from the last day to the full program, and placed on the site map with its current status. The project team sees the same plots and the same map.
- 03
Checked against thresholds
Thresholds are set with the design engineer and drawn on the plots, for example at an alert level and an alarm level. PICO changes thresholds only on the project’s written request, so each change traces to a request on file.
- 04
The right people notified
When a reading crosses a threshold, the personnel on the project’s notification list are alerted by email or SMS. An alert repeats at regular intervals until the triggering condition is resolved.
- 05
Recorded
Alerts, notifications, and threshold changes are written to a record that is never deleted. When a decision made from this data is questioned later, the record shows what was reported, to whom, and when.
PICO Monitoring features
- Works with your project’s sensors and hardware
- PICO connects the loggers and instruments the project specifies.
- Data on a set interval
- Readings at the hardware’s reporting interval, hourly for example.
- Charts and site map
- Each instrument plotted and mapped.
- Email and SMS alerts
- When a threshold is exceeded.
- Reports
- Data summaries, threshold and maintenance events, and data dumps, to the contract’s specification.
- Thresholds on every plot
- Set with the design engineer, drawn on each plot.
- Role-based access control
- Access is by invitation to each project, and each person’s role sets what they can view or change.
- Export
- Any charted data as a CSV.
- Encrypted in transit and at rest
- Every connection to PICO Monitoring is encrypted, and so is the stored data.
- Multi-factor sign-in
- A second verification step at sign-in.
- Redundant storage, isolated per project
- Data is stored redundantly, so no single machine holds the only copy, and each project’s data is isolated from every other.
- A permanent record of alerts, notifications, and user changes
- Alerts and notifications are never deleted, and every change a user makes is logged with the user’s name and a timestamp.
Request a walkthrough
PICO walks you through a demo project, screen by screen, so you can decide whether PICO Monitoring fits your project needs.
- Project dashboard
- Site map
- Graphs
- Alerts
- Audit trail